Graph Single Case Design Data
graph_SCD.RdGraphs single case design data for treatment reversal and multiple baseline designs.
graph_SCD(
  design,
  case,
  phase,
  session,
  outcome,
  cluster = NULL,
  series = NULL,
  treatment_name = NULL,
  model_fit = NULL,
  data = NULL,
  newdata = NULL
)
Arguments
- design
Character string to specify whether data comes from a treatment reversal (
"TR"), multiple baseline across participants ("MBP"), replicated multiple baseline across behaviors ("RMBB"), or clustered multiple baseline across participants ("CMB").- case
vector of case indicators or name of a character or factor vector within
dataindicating unique cases.- phase
vector of treatment indicators or name of a character or factor vector within
dataindicating unique treatment phases.- session
vector of measurement occasions or name of numeric vector within
dataof measurement times.- outcome
vector of outcome data or name of numeric vector of outcome data within
data.- cluster
(Optional) vector of cluster indicators or name of a character or factor vector within
dataindicating clusters.- series
(Optional) vector of series indicators or name of a character or factor vector within
dataindicating series.- treatment_name
(Optional) character string corresponding to the name of the treatment phase.
- model_fit
(Optional) lme fitted model that adds predicted values to graph
- data
(Optional) dataset to use for analysis. Must be a
data.frame.- newdata
(Optional) dataset to use for calculating predicted values based on
model_fit. Must be adata.frame.
Value
A ggplot graph
Note
If treatment_name is left null it will choose the second level of the phase variable to be the treatment phase.
Examples
if (requireNamespace("ggplot2", quietly = TRUE)) {
data(Anglesea)
graph_SCD(design="TR",
case=case, phase=condition,
session=session, outcome=outcome,
treatment_name = "treatment",
data=Anglesea)
data(BartonArwood)
graph_SCD(design="MBP",
case=case, phase=condition,
session=session, outcome=outcome,
treatment_name = "B",
data=BartonArwood)
data(Thiemann2001)
graph_SCD(design="RMBB",
case=case, series = series, phase=treatment,
session=time, outcome=outcome,
treatment_name = "treatment",
data=Thiemann2001)
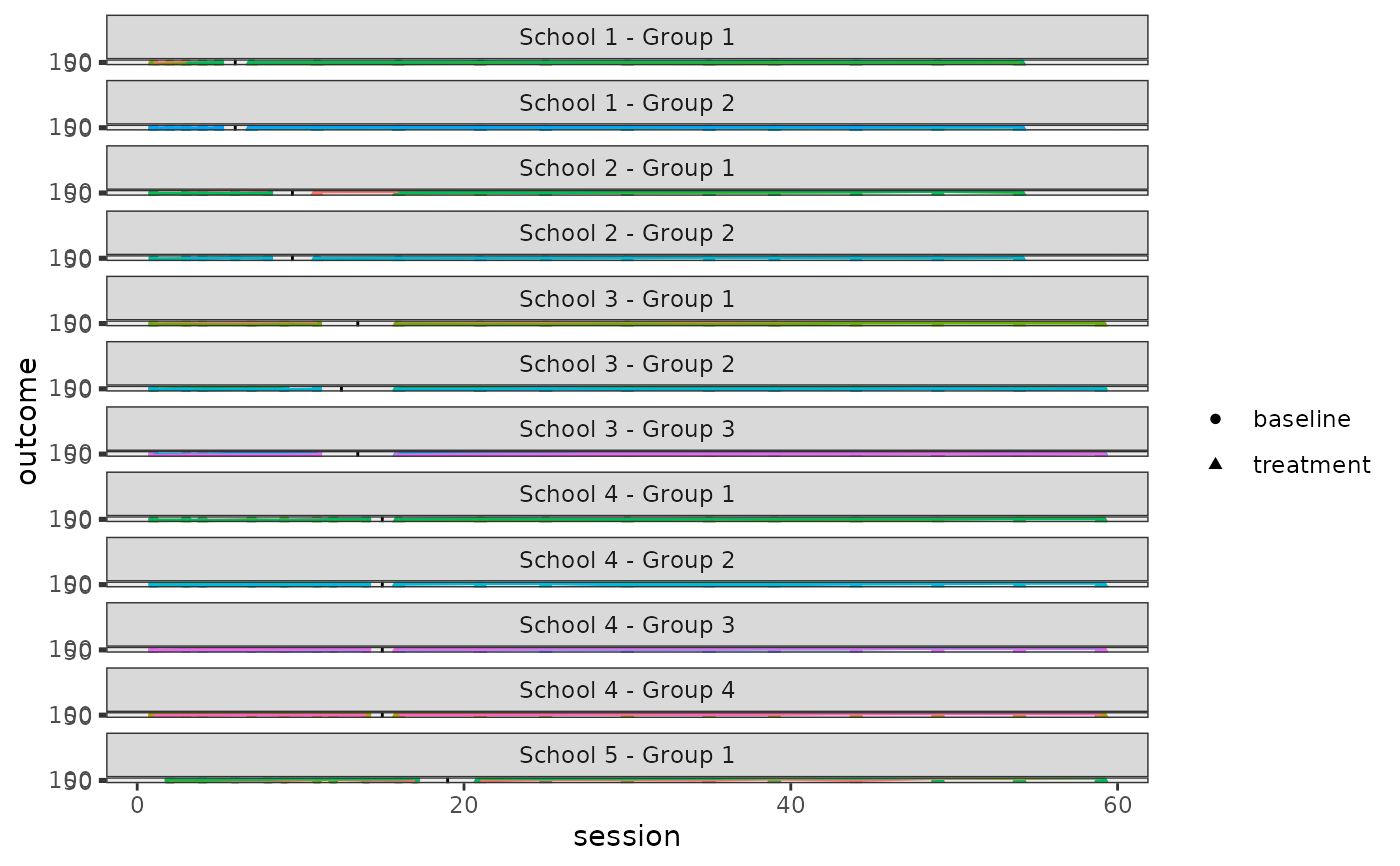
data(Bryant2018)
graph_SCD(design="CMB",
cluster=group, case=case, phase=treatment,
session=session, outcome=outcome,
treatment_name = "treatment",
data=Bryant2018)
}